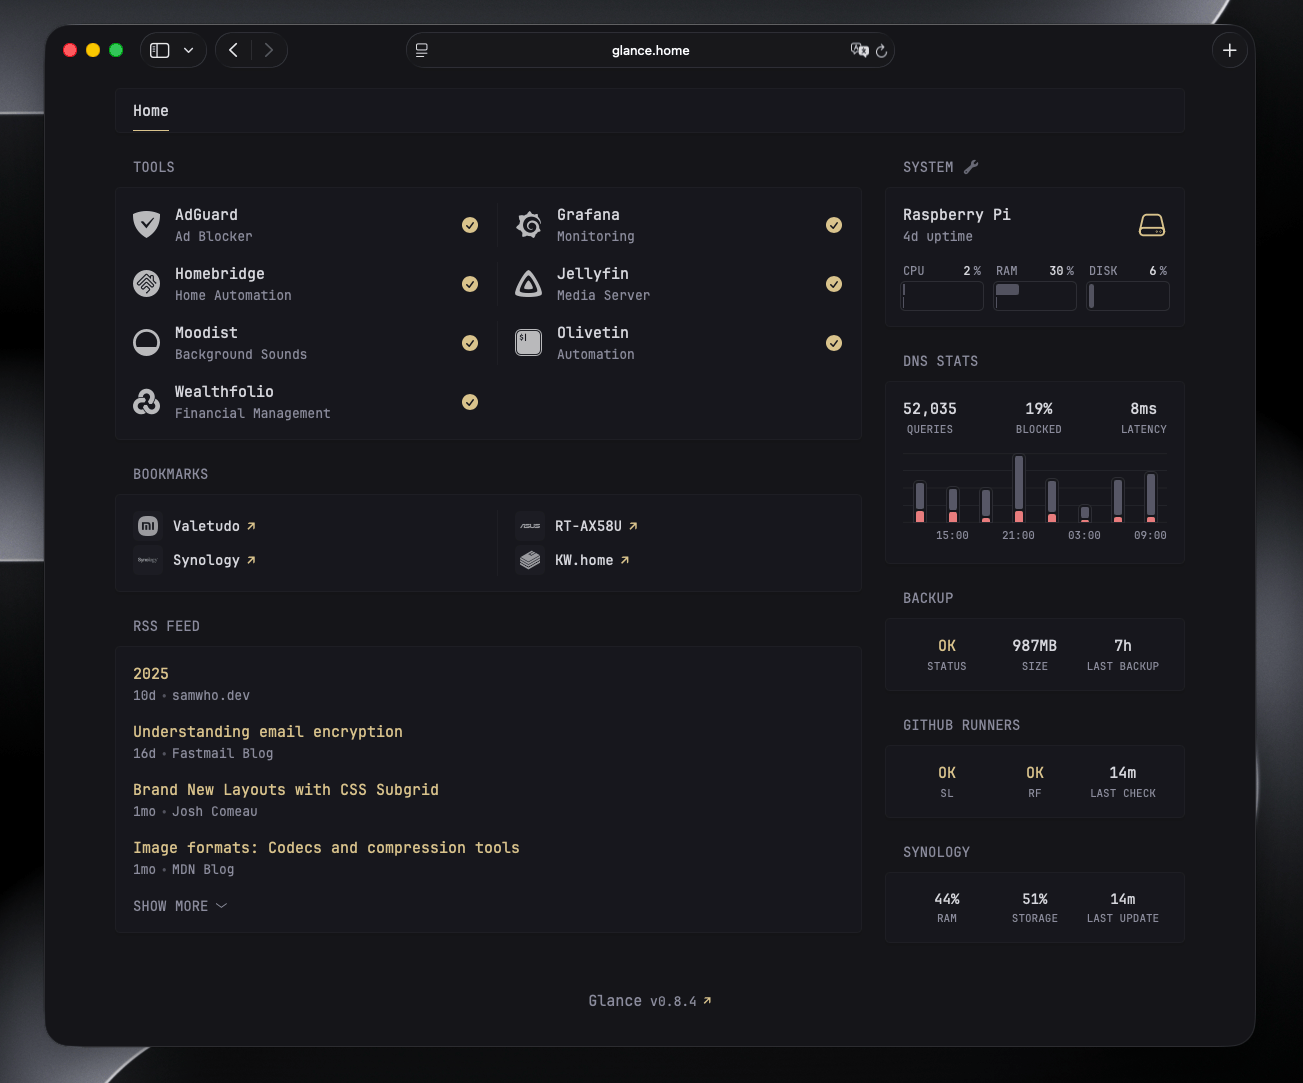
Glance dashboard - pre-cached data
Glance is a popular open-source dashboard for monitoring self-hosted services. It provides a clean and user-friendly interface to visualize various metrics and data from different sources.
I’m using Glance for over a year now, and never had any issue with it. However, as the number of widgets and data sources increased, I noticed that the dashboard started to load slowly, especially on initial load. I have to resign with many widgets just to keep the load time fast. I was also trying to split the dashboard into multiple pages, but it was not an ideal solution, especially when I wanted to see all the data at once. One of the widgets that I wanted to have was Synology Disk Station Widget, but it was increasing the load time significantly, as each authorization request was taking 2-3 seconds.
Recently, I discovered that Glance can load data from JSON files that are hosted via glance-assets directory. Knowing that, I thought that I could use crontab to periodically fetch data from my services and store them as JSON files in the glance-assets directory.
Docker compose setup
Here is my docker-compose snippet for Glance with the necessary volume mappings:
glance:
  image: glanceapp/glance:v0.8.4
  volumes:
    - ./glance:/app/config
    - ./glance-assets:/app/assets # << directory for JSON files
    - /etc/timezone:/etc/timezone:ro
    - /etc/localtime:/etc/localtime:ro
    - /var/run/docker.sock:/var/run/docker.sock
Monitoring Synology NAS
To monitor my Synology NAS, I created a bash script that uses the Synology API to fetch CPU, RAM, and storage utilization data. The script then writes this data to synology_stats.json in the glance-assets directory.
The original code that I used comes from the Glance community widgets repository, which you can find here.
You need to have jq installed on your system to parse JSON responses.
#!/bin/bash
export PATH=/usr/local/sbin:/usr/local/bin:/usr/sbin:/usr/bin:/sbin:/bin

NAS_IP="[YOUR_NAS_IP]"
NAS_PORT="[YOUR_NAS_PORT]" # usually 5000 or 5001 for HTTPS
USERNAME="[YOUR_NAS_USERNAME]"
PASSWORD="[YOUR_NAS_PASSWORD]"
BASE_URL="http://${NAS_IP}:${NAS_PORT}/webapi/entry.cgi"

# Authenticate and get SID
AUTH_RESPONSE=$(curl -s "${BASE_URL}?api=SYNO.API.Auth&version=6&method=login&account=${USERNAME}&passwd=${PASSWORD}&session=FileStation&format=sid")
SID=$(echo "$AUTH_RESPONSE" | jq -r '.data.sid')

if [[ -z "$SID" || "$SID" == "null" ]]; then
  echo "Failed to authenticate with Synology NAS" >&2
  exit 1
fi

# Fetch storage info
STORAGE_RESPONSE=$(curl -s "${BASE_URL}?api=SYNO.Core.System&method=info&type=storage&version=1&_sid=${SID}")

# Fetch CPU and RAM utilization
CPU_RESPONSE=$(curl -s "${BASE_URL}?api=SYNO.Core.System.Utilization&method=get&version=1&_sid=${SID}")

# Parse storage data
TOTAL_SIZE=$(echo "$STORAGE_RESPONSE" | jq -r '.data.vol_info[0].total_size')
USED_SIZE=$(echo "$STORAGE_RESPONSE" | jq -r '.data.vol_info[0].used_size')
STORAGE_PERCENT=$(awk "BEGIN {printf \"%.0f\", ($USED_SIZE / $TOTAL_SIZE) * 100}")

# Parse CPU and RAM data
CPU_PERCENT=$(echo "$CPU_RESPONSE" | jq -r '.data.cpu.user_load')
RAM_PERCENT=$(echo "$CPU_RESPONSE" | jq -r '.data.memory.real_usage')

# Generate timestamp
TIMESTAMP=$(date -u +"%Y-%m-%dT%H:%M:%SZ")

# Write JSON output
cat > /home/jpomykala/Compose/glance-assets/synology_stats.json <<EOF
{
    "timestamp": "${TIMESTAMP}",
    "cpu_percent": ${CPU_PERCENT},
    "ram_percent": ${RAM_PERCENT},
    "storage_percent": ${STORAGE_PERCENT}
}
EOF

echo "Synology stats updated successfully"
Make sure to replace all placeholders with credentials and adjust the output file path.
Save the script as monitor-synology.sh. Don’t forget to give it execute permissions:
chmod +x monitor-synology.sh
I set up a cron job to run this script every 15 minutes:
sudo crontab -e
and add the following line:
*/15 * * * * /home/YOUR_PATH/scripts/monitor-synology.sh
After few minutes, you should see a file created in glance-assets with:
{
    "timestamp": "2026-01-02T10:30:04Z",
    "cpu_percent": 0,
    "ram_percent": 44,
    "storage_percent": 51
}
Glance widget configuration
Here is the Glance widget configuration to display the Synology NAS stats:
- type: custom-api
  cache: 1m
  title: Synology
  url: http://glance.home/assets/synology_stats.json
  template: |
    <div class="flex justify-between text-center">
      <div class="flex-1">
        <div class="size-h4 color-highlight">%</div>
        <div class="size-h6">RAM</div>
      </div>
      <div class="flex-1">
        <div class="size-h4 color-highlight">%</div>
        <div class="size-h6">STORAGE</div>
      </div>
      <div class="flex-1">
        <div class="size-h4 color-highlight" ></div>
        <div class="size-h6">LAST UPDATE</div>
      </div>
    </div>
This configuration uses the custom-api widget type to fetch data from the JSON file that will be updated by the cron job. In my case, the URL is:
http://glance.home/assets/synology_stats.json
but you should adjust the domain or IP address according to your setup.
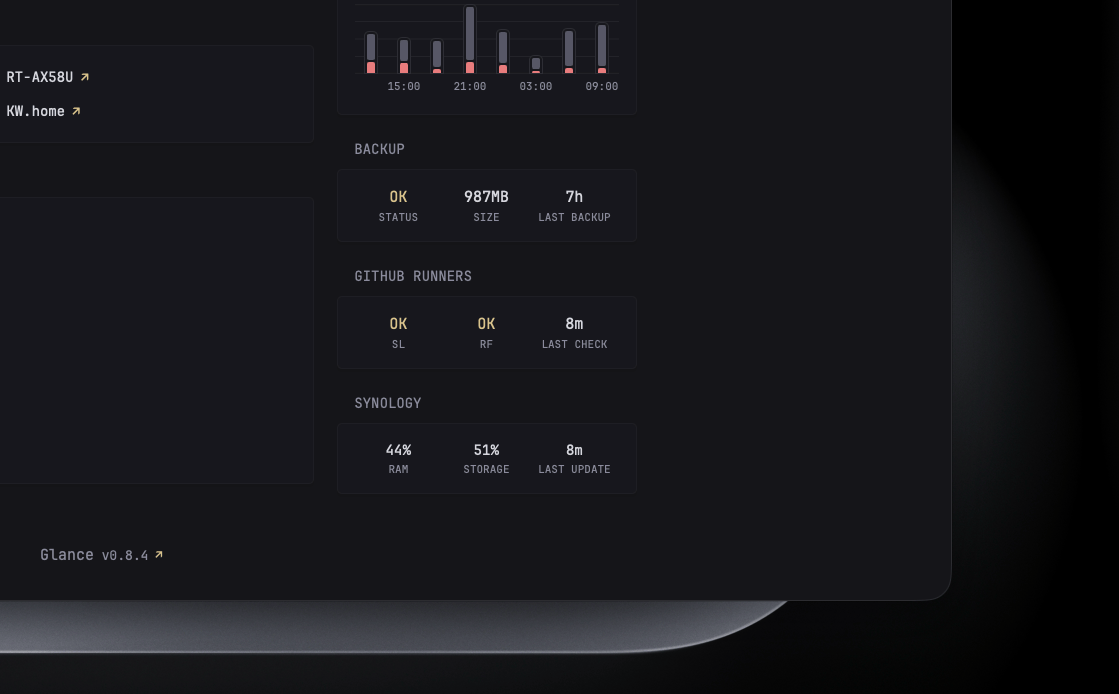
Result
After setting everything up, I was able to add the Synology NAS widget to my Glance dashboard without any noticeable delay in loading time. The data is updated every 15 minutes, and the dashboard remains responsive and fast.
In my case, I also created similar scripts for monitoring other things like, systemctl services, and backups status, all using the same approach of pre-caching data in JSON files.
Support
If you think Glance is as cool as I do, please consider supporting the developer on GitHub Sponsors. I think even a small contribution will make the developer smile. :)